Assignment 11: Polar Equations
By Krista Floer
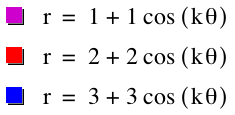
Investigate
![]()
Note:
* When a and b are equal, and k is an integer, this is one textbook version of the " n-leaf rose."
* Compare with
![]()
for various k. What if . . . cos( ) is replaced with sin( )?
DISCLAIMER: TO DOWNLOAD THE FILES ON THIS PAGE, THE PROGRAM GRAPHING CALCULATOR IS NEEDED.
When talking about changing a and b, there are three cases that we can look at: a is greater than b, b is greater than a, and a and b are equal.
Case 1: a is greater than b
Consider these graphs:
 |
 |
 |
|---|---|---|
 |
 |
 |
We can see that from the set of graphs on the left, as the difference between a and b gets larger, the graph looks more like a circle. If a and b are added together for each equation, that will yield the x-intercept on the right side for that equation. To get the x-intercept on the left, subtract a from b. Each of the circles are concentric, meaning they have the same center. By looking at the graph I found the center to be (1, 0). The y-intercepts are controlled by a. There are always two and they are at a and -a.
From the graphs in the middle, we can see that as the difference between a and b stays at 1 but a and b get larger, the indentation of the circle on the left gets deeper. The x-intercepts on the right for these graphs can be found by adding a and b. The left x-intercept will be -1. Something to note about where the indentation stops is that it stops in the same place for all the graphs. Even though the equation creates a larger circle on the right, the indentation is always at -1 for these graphs. This will not stay true if the set of graphs as a whole get translated left or right. The indentation will no longer be at -1, but that point will be the same for all the graphs. The y-intercepts are controlled by a. There are always two and they are at a and -a.
The graphs on the right show what happens when a and/or b is negative. I found when a is negative but b is positive, the graph does not change. To graph the equations, I think that the absolute value of a is used, and b is used. If both a and b are negative or a is positive and b is negative, then the graph is reflected about the y-axis. Also, to determine if a is greater than b, the absolute value of both a and b are compared.
Click here to download the GCF file for the graphs on the LEFT, the MIDDLE, and the RIGHT.
Case 2: b is greater than a
Consider these graphs:
 |
 |
 |
|---|---|---|
 |
 |
 |
From the graphs on the left we see that the indentation point for all the graphs is at (0, 0). The pattern I see emerging is as a stays at 1 and b gets larger, the inside loop and outside loop of each graph gets larger. There are 3 x-intercepts for each graph; all of them sharing 0. The x-intercept occurring with the small loop can be found by subtracting a from b. After further investigation, I found that this holds true even when a is not 1. The x-intercept occurring with the outer loop is found by adding a and b. The y-intercept again is controlled by a.
The pattern for the graphs in the middles seem similar to the pattern seen in the graphs above on the right. As the difference between a and b stays at 1 but a and b get larger, the small loops get closer together. One x-intercept for all the graphs will be at 0. The x-intercept of the small loop is found by subtracting a from b. The x-intercept of the outer loop is found by adding a and b. a controls the y-intercept.
The graphs on the right follow the same pattern as the graphs on the right above.
Click here for the GCF file of the graph on the LEFT, the MIDDLE, and the RIGHT.
Case 3: a and b are equal
Consider these graphs:
| Graph when a and b are equal | Graph when a and b are equal | Graph when a is greater than b |
|---|---|---|
  |
  |
|
 |
 |
|
Comparing the middle and right graphs, we see they look similar but that the indentation of each is sharper in the middle graph. Also, instead of having an intercept at x = -1, the intercept is at x = 0. a still controls the y-intercepts with one at a and the other at -a. The second x-intercept is found the same way as the others, adding a and b together. The graph on the left is the same as the graph in the middle except each equation has been reflected over the y-axis. It is the same finding as above.
Click here to download the LEFT, the MIDDLE, and the RIGHT graph.
Now that we have thoroughly investigated what a and b do, we need to find out what k does...
I started by fixing the values for a and b and just changing k. I started with k = 1, 2, and 3:
 |
|---|
 |
From these graphs, we can see that as k changes, the number of "petals" on the graph changes. The number of petal corresponds directly to k. I found two patterns if a and b are changed instead of being held constant at 1. As stated above in the assignment problem, this is called the n-leaf rose. Consider these graphs:
 |
|---|
 |
We can see that as a gets larger than b, the petals do not go in as far towards the center. As a and b stay the same, the graph stays similar except for following the rules outlined above for where the x and y intercepts are. As b gets larger than a, another set of petals come out. If a stays constant and b gets large enough, all of the pedals appear to become the same size.
Changing k does not change the graph visually. It looks exactly the same as when k is positive. The rose does not always have whole petals, sometimes there are partials. The partials appear when k is not a whole number.
 |
When we look at what sine does instead of cosine, we get this:
 |
|---|
We can see that the cosine function and sine function are out of sync just a little bit. This should have been predictable because the basic sine and cosine function are exactly the same except one is delayed from the other.